
Continuing the saga of Alan Cash and Terra Biological, trying to get a dietary supplement containing oxaloacetate into clinical trials for all sorts of conditions from long-covid to PMS, there appears to have been a “breakthrough“!
The company finally got around to publishing the results of a clinical trial on the effects of OAA on self-reported symptoms of chronic fatigue syndrome / myalgic encephalomyoelitis (CFS/ME). Now, this is a condition that scientist George Monbiot has called “The greatest Medical Scandal of the 21st Century”, so straight away that should start raising flags. Why pick a poorly-defined condition, the very existence of which is hotly debated?
Prima facie, the results appear promising and statistically significant, and it’s also commendable that the group chose to provide the complete (not actually) data set. However, digging into the data there are are several problems…
The number of patients is “wobbly”
The trial started out with 40 patients in the control arm and 42 in the treatment arm. However, there was apparently a greater attrition rate in the controls (12 leaving) than the OAAs (5 leaving). This would leave 28 controls and 37 OAAs as “completers” of the trial, as nicely explained in the flow diagram in Figure 3 of the paper and in the manuscript text…
…which makes it a bit weird when we go to the original data set (re-hosted here) and see there are actually 29 controls! Where did the extra control patient come from?
Biased reporting of patients who got worse
Things get real squirrelly when we look at Figure 5 of the paper. The y-axis here is number of patients, the x-axis is the change in fatigue score pre/post trial. The orange are controls and the blue OAAs.
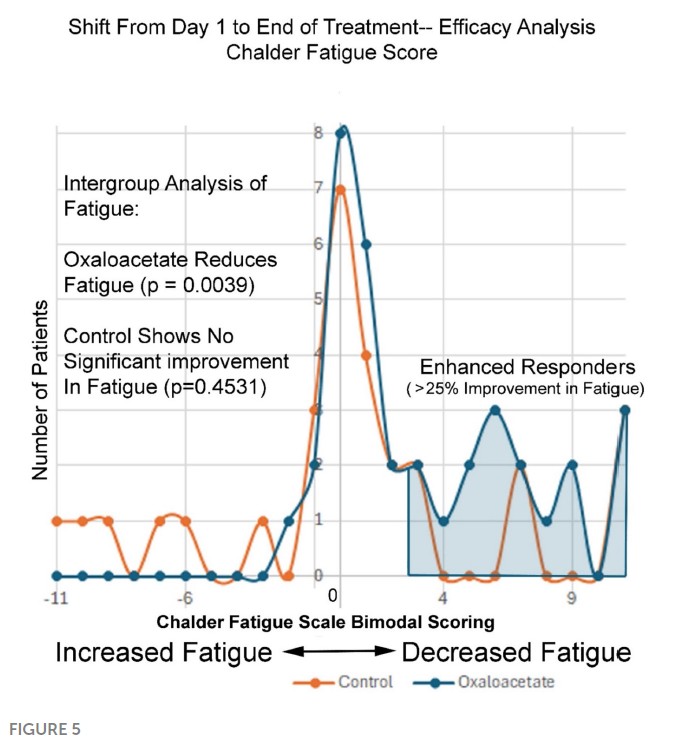
It’s a fairly simple matter to look at the dots and count the number of patients at each score point, then add them up. Doing so, we again arrive at 29 for the controls. BUT, importantly there are only 35 patients in the OAA set. We’re missing two of them, and by looking at the original data we find there were indeed two patients on OAA whose scores got worse (-4). They were simply eliminated from this graph, making it appear as if no patients on OAA got worse.
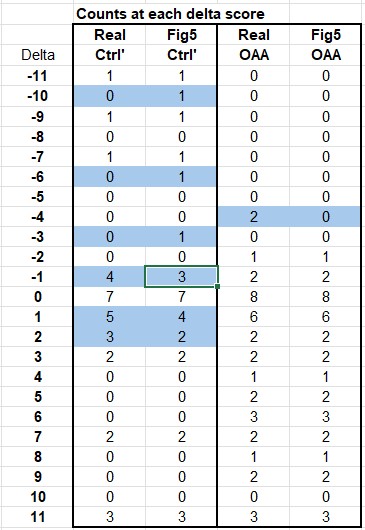
There are other discrepancies between the data and this graph, as shown in the table below. Anything highlighted blue doesn’t match up. There are 3 instances where a ‘1’ was assigned to the control group in the figure, suggesting a patient got worse, when in-fact there was no patient getting worse at that score level. Furthermore, there are 2 patients who got better in the control group but were not counted on the graph…
Plotting Figure 5 as shown in the paper (left image below) alongside the real data (on the right) shows the way in which the paper makes it appear the controls got worse. In the published version there are more orange (control) points above the x-axis on the left side of the graph (worse scores). Notice the missing 2 OAA patients who also got worse (at -4 in the right hand graph).
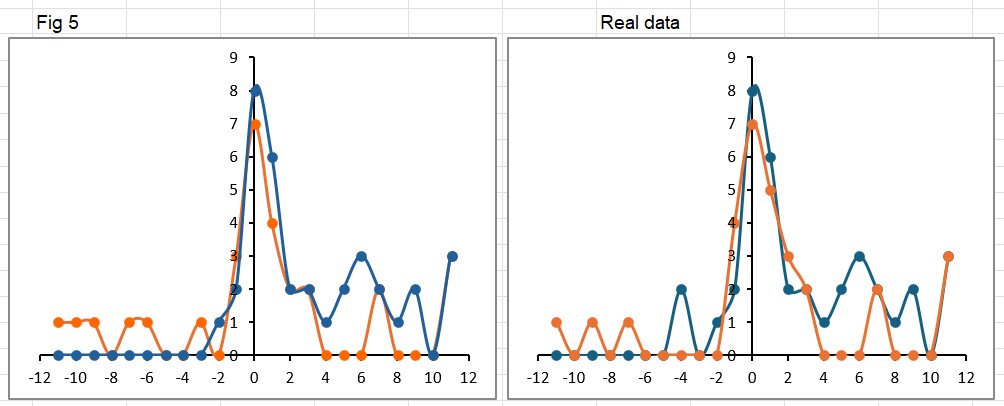
Just for fun, I also switched the order of the data series, so now the controls (orange) appear on top of the OAAs (blue) in the “real” graph on the right. This highlights the 3 controls who had a big improvement of 11 points… the same as the OAA group. It’s amazing what little differences like this can make to the perception of a result.
Trial non-completers?
Now remember, Figure 5 is only the folks who completed the trial. As already mentioned, many did not. By comparing the data from the completers vs. the whole set, we can gain some more insight into the non-completers group, as shown in this table below.
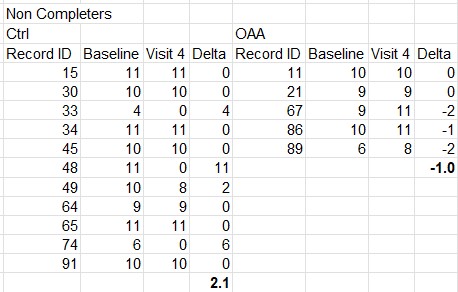
What this shows, is of the 11 controls who quit early, they had an average improvement score of 2, and none of them got worse during the trial. However, of the 5 in the OAA arm who quit early, 3 of them actually got worse.
Combining the analysis of the completers and non-completers, overall in the control group 7 patients got worse during the trial, but none of them quit early. However, in the OAA group 8 patients got worse during the trial, and 3 of them quit early. Readers can judge for themselves whether there may have been any sort of “encouragement” applied to certain groups who were feeling worse to quit the trial early, but no such encouragement applied to those in the other group.
Appropriate Statistical Tests
Lastly, I’m not a statistician but my understanding is that when testing if 2 groups are different from each other, without knowing in advance which direction any difference might be, you should use a 2-tailed T-test. For some reason, here the authors chose to use 1-tailed tests for everything, i.e., they only hypothesized that the results would go in one direction (presumably OAA being better than control), and not the opposite possibility. Needless to say, if you re-do the tests applying the proper criteria, some of the differences get a lot smaller or vanish altogether. For example, in Figure 4 the p-value of 0.057 is described in the text as “trending toward significance”.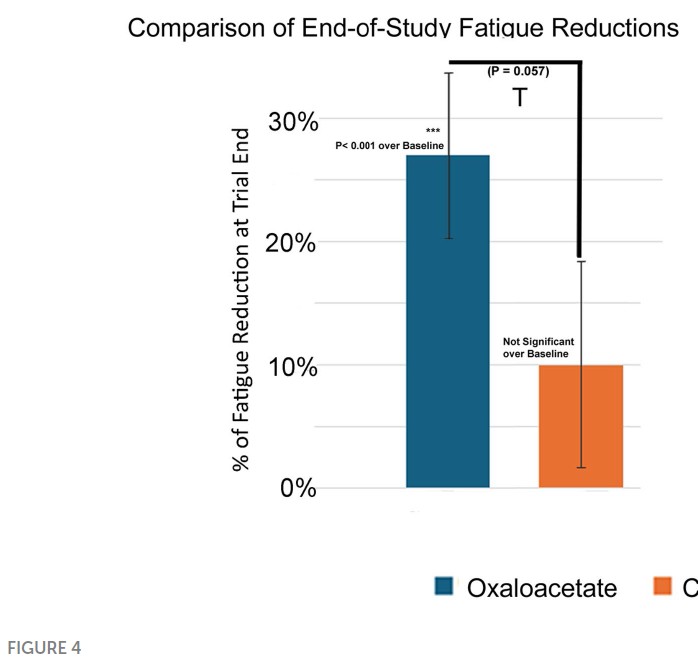
Performing this test with 2 tails yields a far-less impressive p-value of 0.114, quite literally nothing to write home about.
Wrapping this up
Let’s not get into the numerous typos in the paper that really speak more about the shitty editorial standards at Frontiers than anything else. Further illustrating such problems – one person who reviewed the paper (Alison Bested) has published with at least two authors on the paper (Yellman and Bateman) as recently as 2021, so it was reviewed by familiar folks. The discussion of the paper repeats many of the mistakes regarding the simple biochemistry of OAA that I’ve written about in the past. Bottom line, yet again, the company shilling a $600 a year supplement has managed to get something published with a veneer of scientific legitimacy in a not very good (predatory?) journal. A not-very-deep-dive shows problems with data reporting and the basic arithmetic keeping track of numbers of patients. Don’t human patients with hard-to-diagnose-and-measure chronic diseases deserve better than this?