I’ve been meaning to write about this for a while, but what with running the lab, teaching, trying to stay on top of the poly-crisis of the NIH funding situation, starting an MBA, and doing my best to avoid GenAI wherever possible, it got put down the priority list. That’s unfortunate because this is a fun story…
If you work in mitochondria circles, you may have heard of the Guy Foundation? It’s a charitable trust in the UK – a philanthropic effort from Geoffrey Guy, who made his money as co-founder of GW pharmaceuticals, the first company to get cannabis derived medications approved for human use. GW was sold to a US company for $7.2bn in 2022. Dr. Guy seems like a decent… guy… (sorry), and let me be clear this post is not intended as a personal attack on him, the company he founded, or the mission or operations of the Guy Foundation (GF). Rather, I want to highlight the absolute bonkers batshit crazy science the foundation is spending its money on.
Flashy Science
Let’s get right into it, with the idea that mitochondria can communicate using light, explained in a YT video from Dr. Guy himself. Building on the widely accepted idea that mitochondria run on electricity (something, something, membrane potential, millivolts – go read Peter Mitchell’s “little grey book”), the GF seems to think mitochondria produce photons as well. In-fact, much of the “science” funded by the GF is on the topic of biophotonics – the release and sensing of photons by biological systems.
Aside: There are myriad examples of biological systems that produce light – firefly luciferase being most familiar. These have been extensively characterized at the molecular level and reconstituted outside the original organisms – all useful and well-documented science. That’s not what this is about.
The paper that warrants the batshit label is this one. Published in that bastion of scientific excellence Frontiers in Physiology, it comes from the lab of Jimmy Bell at the University of Westminster in London. Bell and first author Rhys Mould are part of the Research Center for Optimal Health at Westminster. The work was funded by the GF, as proudly claimed on their website and noted in the paper.
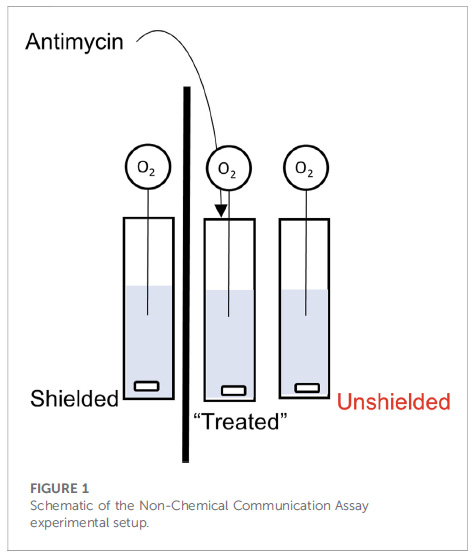
So what’s the problem? Well, let’s start with a description of the experimental set-up from figure 1 of the paper: 3 cuvets with stir-bars at the bottom, each containing a suspension of isolated mitochondria. The left cuvet is separated from the others by a piece of cardboard (the thick black line), while the one on the right is next to the central one (i.e., “unshielded”). Into each cuvet is placed a needle-type O2 electrode, to measure O2 consumption by the mitochondria. Let’s number these cuvets 1, 2, 3 from left to right.
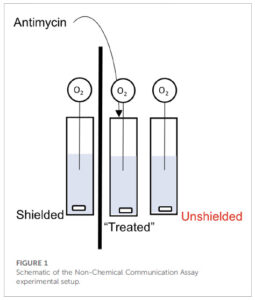
Now here’s the kicker… they add the mitochondrial inhibitor antimycin to the central cuvet (#2), and then claim the mitochondria in cuvet #3 respond by changing their O2 consumption (respiration), but the mito’s in the cuvet #1 do not. Not only that, the mechanism of communication involves mitochondria in cuvet #2 emitting photons and those in cuvet #2 sensing them.
Let’s ignore for just a second a couple of other minor problems with the methods, such as the use of 244uM antimycin (enough to tranq’ a horse) and the complete lack of any added metabolic substrate to support the mitochondrial respiration. Let’s instead focus on section 3.4 of the discussion…
“3.4 Comparing “light” and “dark” experiments. Finally, we compared the change in OCR between unshielded mitochondria in light conditions versus dark conditions, shown in Figure 6. In MCF7, the rate of OCR change was significantly higher in light conditions compared to dark conditions.”
OCR here stands for “oxygen consumption rate”. In other words, this magical communication between cuvets via photons was actually more pronounced when the system was flooded with gazillions of photons from the room lights, versus in the dark – exactly opposite to how low-intensity light phenomena are supposed to work. Batshit is not nearly a strong enough descriptor.
Yeah yeah nit-picky details, what’s the real problem? Dear reader, take a look again at Figure 1 above. Do you see any type of lid on the apparatus, or anything separating the liquid part (blue) from the air above it?
The problem is, the way to measure mitochondrial respiration / OCR / O2 consumption, is in a CLOSED system such as a Clark type oxygen electrode, of which there are numerous vendors available, or alternative platforms. Every one of these instrument makers will tell you that the liquid in which [O2] is measured (e.g. a suspension of mitochondria or cells at the bottom of a well) MUST be sealed off from the atmosphere… even the tiniest air bubble will mess up the readings.
This is simple chemistry – air is 21% oxygen – much higher than the solubility of oxygen in water (about 200 micromolar at 37C). If there’s any contact between the liquid and the air, any O2 consumed by mitochondria in solution will be instantly replaced by that from the air, so the concentration of O2 in the liquid will stay the same. It’s the CHANGE in O2 concentration that’s used to determine the RATE of O2 consumption (that’s the “R” in OCR). No change in [O2]? No rate.
Simply put… it is damn near impossible to measure OCR in an open system such as this (well, technically it’s possible using precise mixing at the gas-liquid interface, a complex series of engineering formulas, lots of math, and a full understanding of the problem just described, but that’s not what happened here).
Show Me The Data
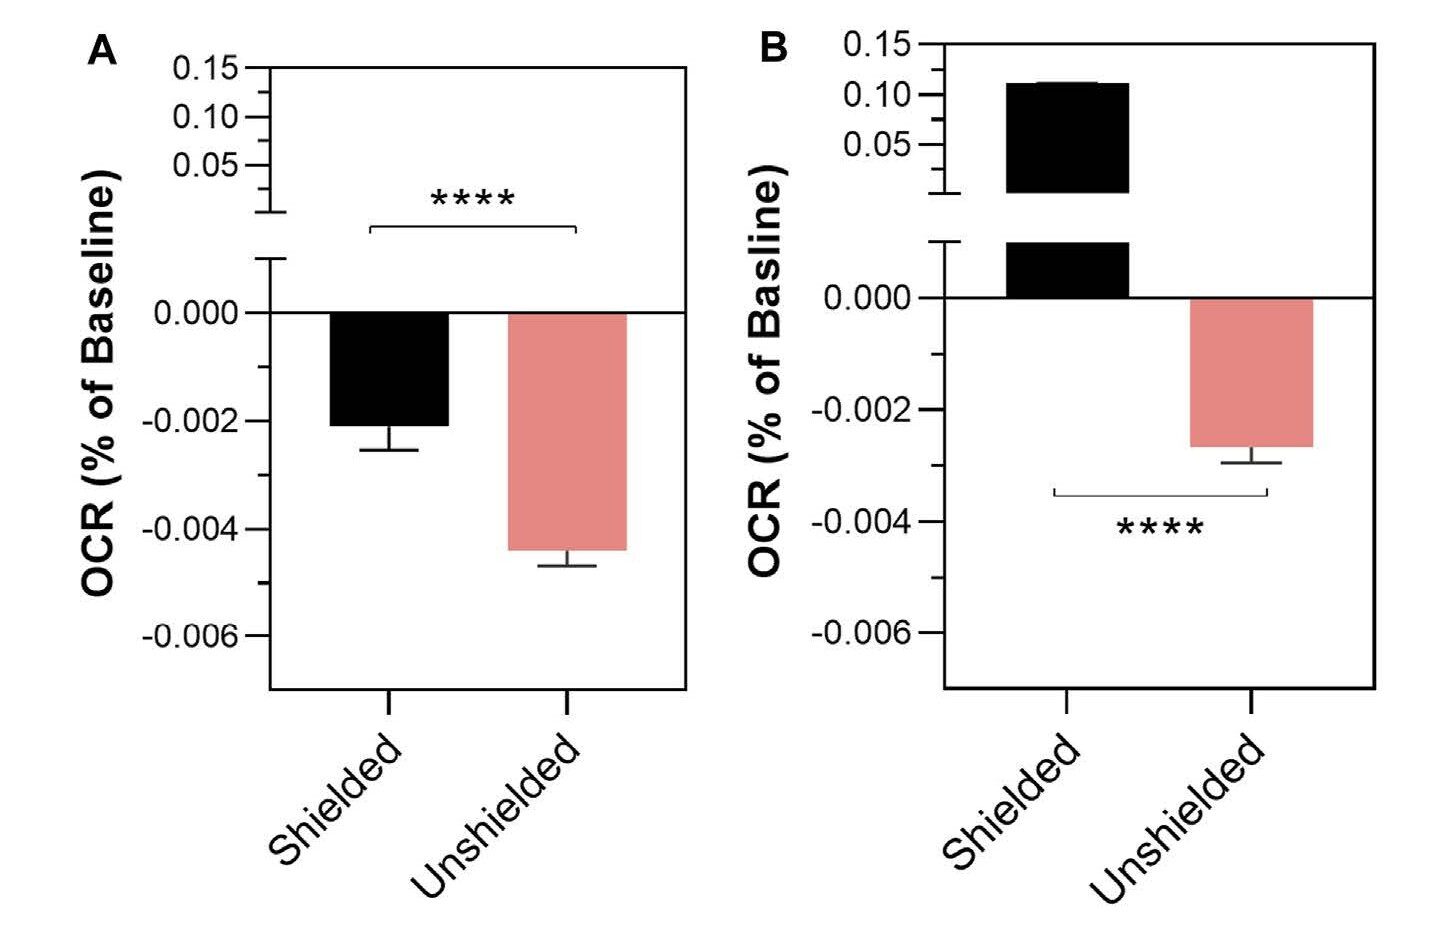
The “data” in the paper are presented in a manner completely opaque and unfamiliar to anyone who does these types of experiments. The change in oxygen consumption rate (remember – there is no rate) in cuvets #1 and #3 following antimycin addition to cuvet #2 is shown in Figure 2…

Your eyes do not deceive you.. there was a 0.004% change in OCR in the cuvet that was exposed to a big old dose of pew-pew mito lazer beemz (#3, pink bar) but only a 0.002% change in the mito’s that were shielded by a bit of cardboard (cuvet #1, black). Tip – remember the direction these bars are pointing, for later on.
Far be it from me (a non-statistician) to wonder at the levels of intricacy and convolution required to detect a 0.004% change in anything, but this does not seem to be: (A) at all measurable, (B) of any importance. For context, this is like someone who earns $100k a year getting a $4 pay cut. It should therefore come as no surprise that the statistics section of the paper will also appear odd to anyone familiar with such experiments…
“Differences in the rate of mitochondrial oxygen consumption
were analysed using a mixed linear effects model written in R”
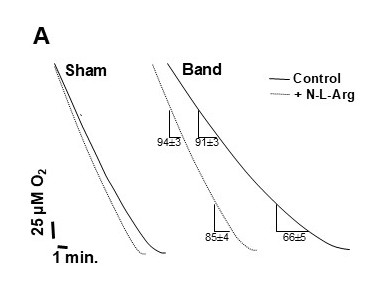
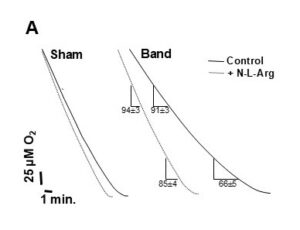
Complete overkill. This is not how it’s done. You calculate the rate (slope of the O2/time trace) and (after checking for normalcy) use simple statistical tests to see if the values are different, with appropriate multiple-testing corrections if necessary. If you want to get fancy you could even use the real-statistics plug-in for Excel, but you absolutely do not need a mixed linear effects model to see the difference between 2 diagonal lines on a trace. Here’s an example from one of my very old (fuzzy) papers. This is what real oxygen consumption traces look like. You can see that one line is different from the other. Compare this to what you’re about to see further down the page.
Show Me The Data – Part 2
As a polite science critic, my first course of action upon reading this paper (well, OK, not my first choice) was to make a nice post over on PubPeer, bringing up the above points and more.
To the authors’ credit, they did respond to clarify some of the experimental details, but in some cases this only confirmed my concerns (e.g. there was a lid made of parafilm, but still a head-space, and indeed the buffer contained no fuel for the mitochondria to respire on). Most importantly, the authors were gracious enough to share the original data set on FigShare. Absolute stellar move. Kudos. Love it. I’ve been using FigShare since 2016 and everyone should do this! The problem is when you actually plot the data from the Excel sheet, as predicted from the impossibilities discussed above, there is no rate. The concentration of oxygen is flat over time, because it’s at equilibrium with the atmosphere.
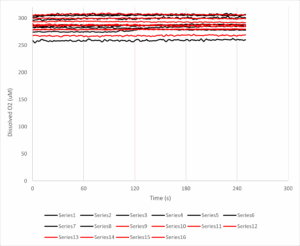
The y-axis here is dissolved oxygen (in micromolar, you’ll note it’s a bit higher than the usual 200 uM, likely because these experiments were done at room temp’ and O2 solubility is an inverse function of temperature). The x-axis is time in seconds, and the antimycin A was added at 120s. The black lines are 8 samples from the unshielded cuvet, and the red lines are the shielded cuvet.
Put simply THERE IS NO DOWNWARD SLOPE, THERE IS NO OXYGEN CONSUMPTION RATE TO SPEAK OF. Some of the lines even slope upwards, so the [O2] in solution is actually increasing over time. If we calculate the rates before and after the antimycin addition, the numbers (mean +/- standard error) come out as follows:
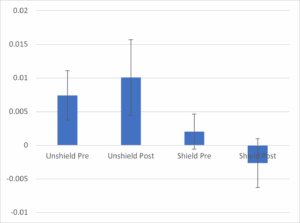
The chart shows the average rate (N=8 per group) for the unshielded cuvets (left 2 bars) vs. the shielded cuvets (right 2 bars), pre vs. post antimycin addition to the central cuvet. There is no difference between bars 1 and 2 – if anything the slope of the line (which is already close to zero!) increases instead of decreasing as claimed in the paper (compare this to Figure 2, above). The error bars (standard error of the mean) also show that whatever difference there may be is statistically non-significant – no fancy linear mixed regression what-have-you. Looking at the unshielded vs. shielded groups at baseline (bar #1 vs. #3) you could even say they show a bigger difference than pre/post antimycin. In other words, regardless of any mito’ communication voodoo, having a bit of cardboard next to you causes your O2 consumption to drop from very close to zero, to very actually zero, before any mito’ poisons are added to your neighbor.

Furthermore, the control data (cuvet #2) are not included, so we don’t even know if the massive dose of antimycin did anything. It probably inhibited the mitochondria, but there would be no change in [O2] because, as explained above, any O2 consumed by the mito’s would be replaced by that from the atmosphere, so the trace would remain flat. The difference between a flat line and a flat line, is nothing.
Anyway, I’d encourage anyone who enjoys playing around in Excel or R to take a look at these data and produce a single shred of evidence that the main conclusion is valid.
Let me be clear – not only is the key claim of this paper utterly bonkers, it’s based on a total lack of evidence, with a complete misunderstanding of how to measure mitochondrial function.
Surely this should be retracted?
Of course it should! But since when did doing the right thing matter for publisher Frontiers? (just ask Leo Schneider). I wrote to the person who edited the paper, YoungChan Kim at the University of Surrey, UK, but he didn’t bother to respond. Neither did John Imig the chief editor for this field section of Frontiers in Physiology. A good friend who is involved with the journal did respond to my inquiry, but they were not involved with handling the paper and so could not do anything about it. There was a bit of chatter in the PubPeer thread, which died down as soon as I posted a “no rate” graph similar to the one above.
Importantly, David Fernig raised the point that this is not an impossible experiment to do properly. You just need a very sensitive photomultiplier tube to detect photons, and tightly controlled other conditions (sealed chambers, dark room, temperature regulation, filters to control the wavelengths of light passing between samples, etc). Maybe this IS something worth investigating? Maybe the GF should give the money instead to someone who understands this?
How will this “knowledge” be used?
The paper is still out there, and people are still using it to make ridiculous claims. The GF is lauding the work in their newsletter, as well as the aforementioned video, the lead author also talks about it in video format. The foundation appears very proud of the work it funded, which is unfortunate because it’s not very good at all.
Of course, if you believe mitochondria can influence each other via light, it’s a small step away to hack that biology by shining bright lights on various body parts, which brings us neatly into crazy anti-aging therapies, such as the claims that red light can energise your mito’s. I’ve made my thoughts on the shit-show that is anti-aging biotech abundantly clear before. While there are certainly biological effects that can be attributed to certain wavelengths of light, they are usually based on rigorous experimentation (such as the paper just cited, from a well-known group in the field at MCW). The Frontiers paper is not an example of quality science.
There’s a lot more to be written on the various out there projects and papers claiming all sorts of weird quantum effects on mitochondria. It’s not just light… there are all kinds of papers about electromagnetic fields and mitochondria. Claims that mitochondria operate at high temperatures inside cells. Mitochondria allegedly respond to music and other sounds.
But for now, we just have to wonder how does a charitable foundation hand over non-trivial amounts money to fund “pew-pew mito space photon lazer beemz”, and then when the project execution and results are complete garbage, they just accept everything at face value? No admission that anything silly happened. No acknowledgement that the work is absolutely fundamentally flawed, and was not performed in a way that could give meaningful outcomes. It’s an alternate reality!